Connect Your First System
You have an account and an empty dashboard. In this step you'll connect a system you already run — a GitHub org, an AWS account, your Google Workspace — and trigger the first collection. When it completes, you'll have findings to work with.
QuantAssure gets data two ways: pull (QuantAssure runs collectors against a system on a schedule or on demand) and push (marketplace connectors send events as they happen). Start with pull — it's a form and a button.
Systems: Pull-Based Collection
A system is something you monitor — "Production API", "Corporate Workspace" — with its own data-source configuration. (Systems were called Scopes until October 2026; see Where did everything go.)
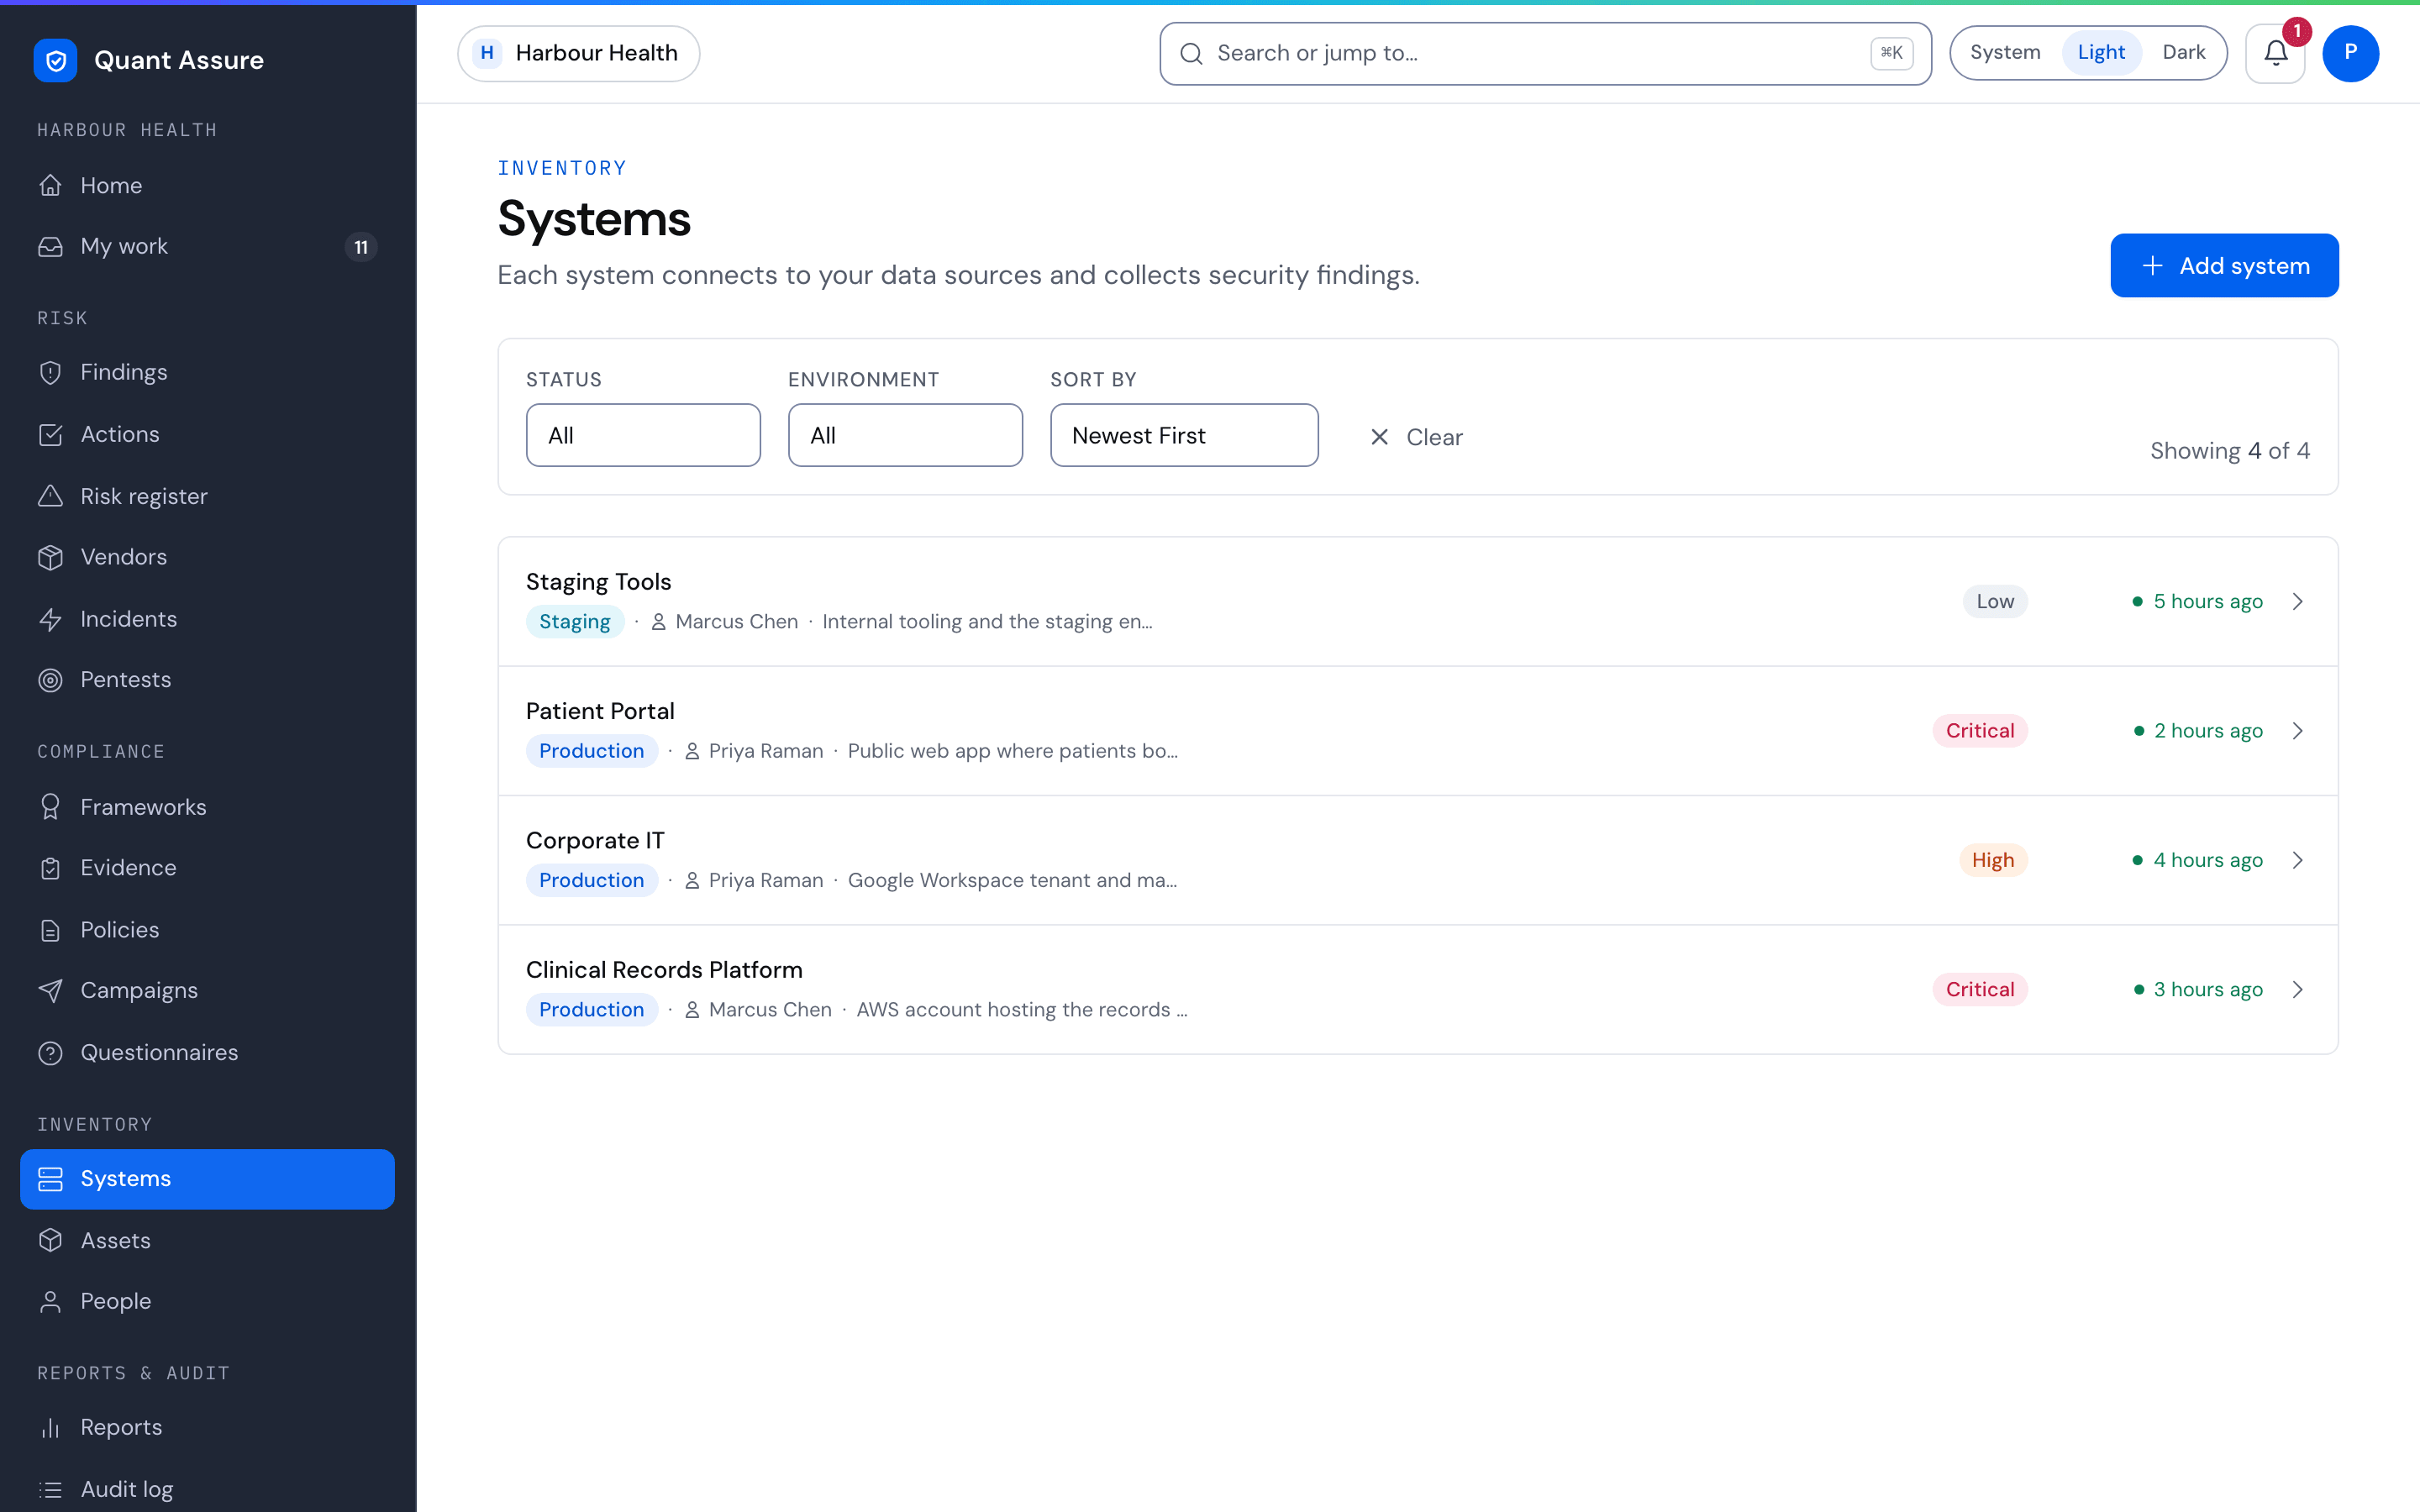
To add one: Inventory → Systems → Add system, then:
- Name and classify it — type, environment (production/staging/dev), criticality, and data classification. The AI uses these when weighing a finding's real risk: the same vulnerability rates differently in a production system holding customer data than in a sandbox.
- Enable collectors and provide credentials. Each
source has its own card on the system form:
- GitHub — repositories as inventory; Dependabot alerts (on by default) and security-posture checks become findings
- AWS — your logging set-up (CloudTrail, CloudWatch, GuardDuty and S3) checked against ISM controls
- AWS Security Hub — Security Hub findings, with its own AWS credentials. Available on every plan and does not need Pulumi or AWS turned on
- Pulumi — cloud infrastructure recorded in Pulumi state
- Google Workspace — user inventory with MFA status, admin roles, and login activity; findings for email security settings, missing MFA and stale accounts
- Mosyle MDM (Apple devices) — managed devices; a finding for each device that fails a Mosyle Hardening & Compliance group
- Google Drive — imports policy documents for the AI's organisational context
- Fill in the required settings — when you turn a source on, its required settings are marked with an asterisk. If you save with some left empty, every empty one is marked at once, under its own field and named as it is on the form (for example "Organisation is required"), and the first is selected.
- Check the connection — where connection checks are available, saving a collector's credentials or settings tests them straight away, without running a scan. The Connection panel on the system's edit page shows each collector as Connected, Failed (with the provider's error, credentials removed), or Not enabled. Results usually appear within a minute or two. Use Test connection to re-test at any time. The button is greyed out, with the reason beside it, while no source is enabled in the saved configuration: turn a source on, enter its credentials and save first. If your edit page has no Connection panel, connection checks are not available for your organisation yet: saving does not test anything, so use Run Now to find out whether the credentials work, and read the failure on the system page if they do not.
- Run it — trigger the first collection from the system page with Run Now (see Run Now and Full Resync), or leave it: new systems run on a daily schedule, so the first scheduled run starts within the hour.
Scheduled runs
Each system has a run schedule: Daily (the default), Weekly or Off. A run started by the schedule is marked Scheduled in Run History.
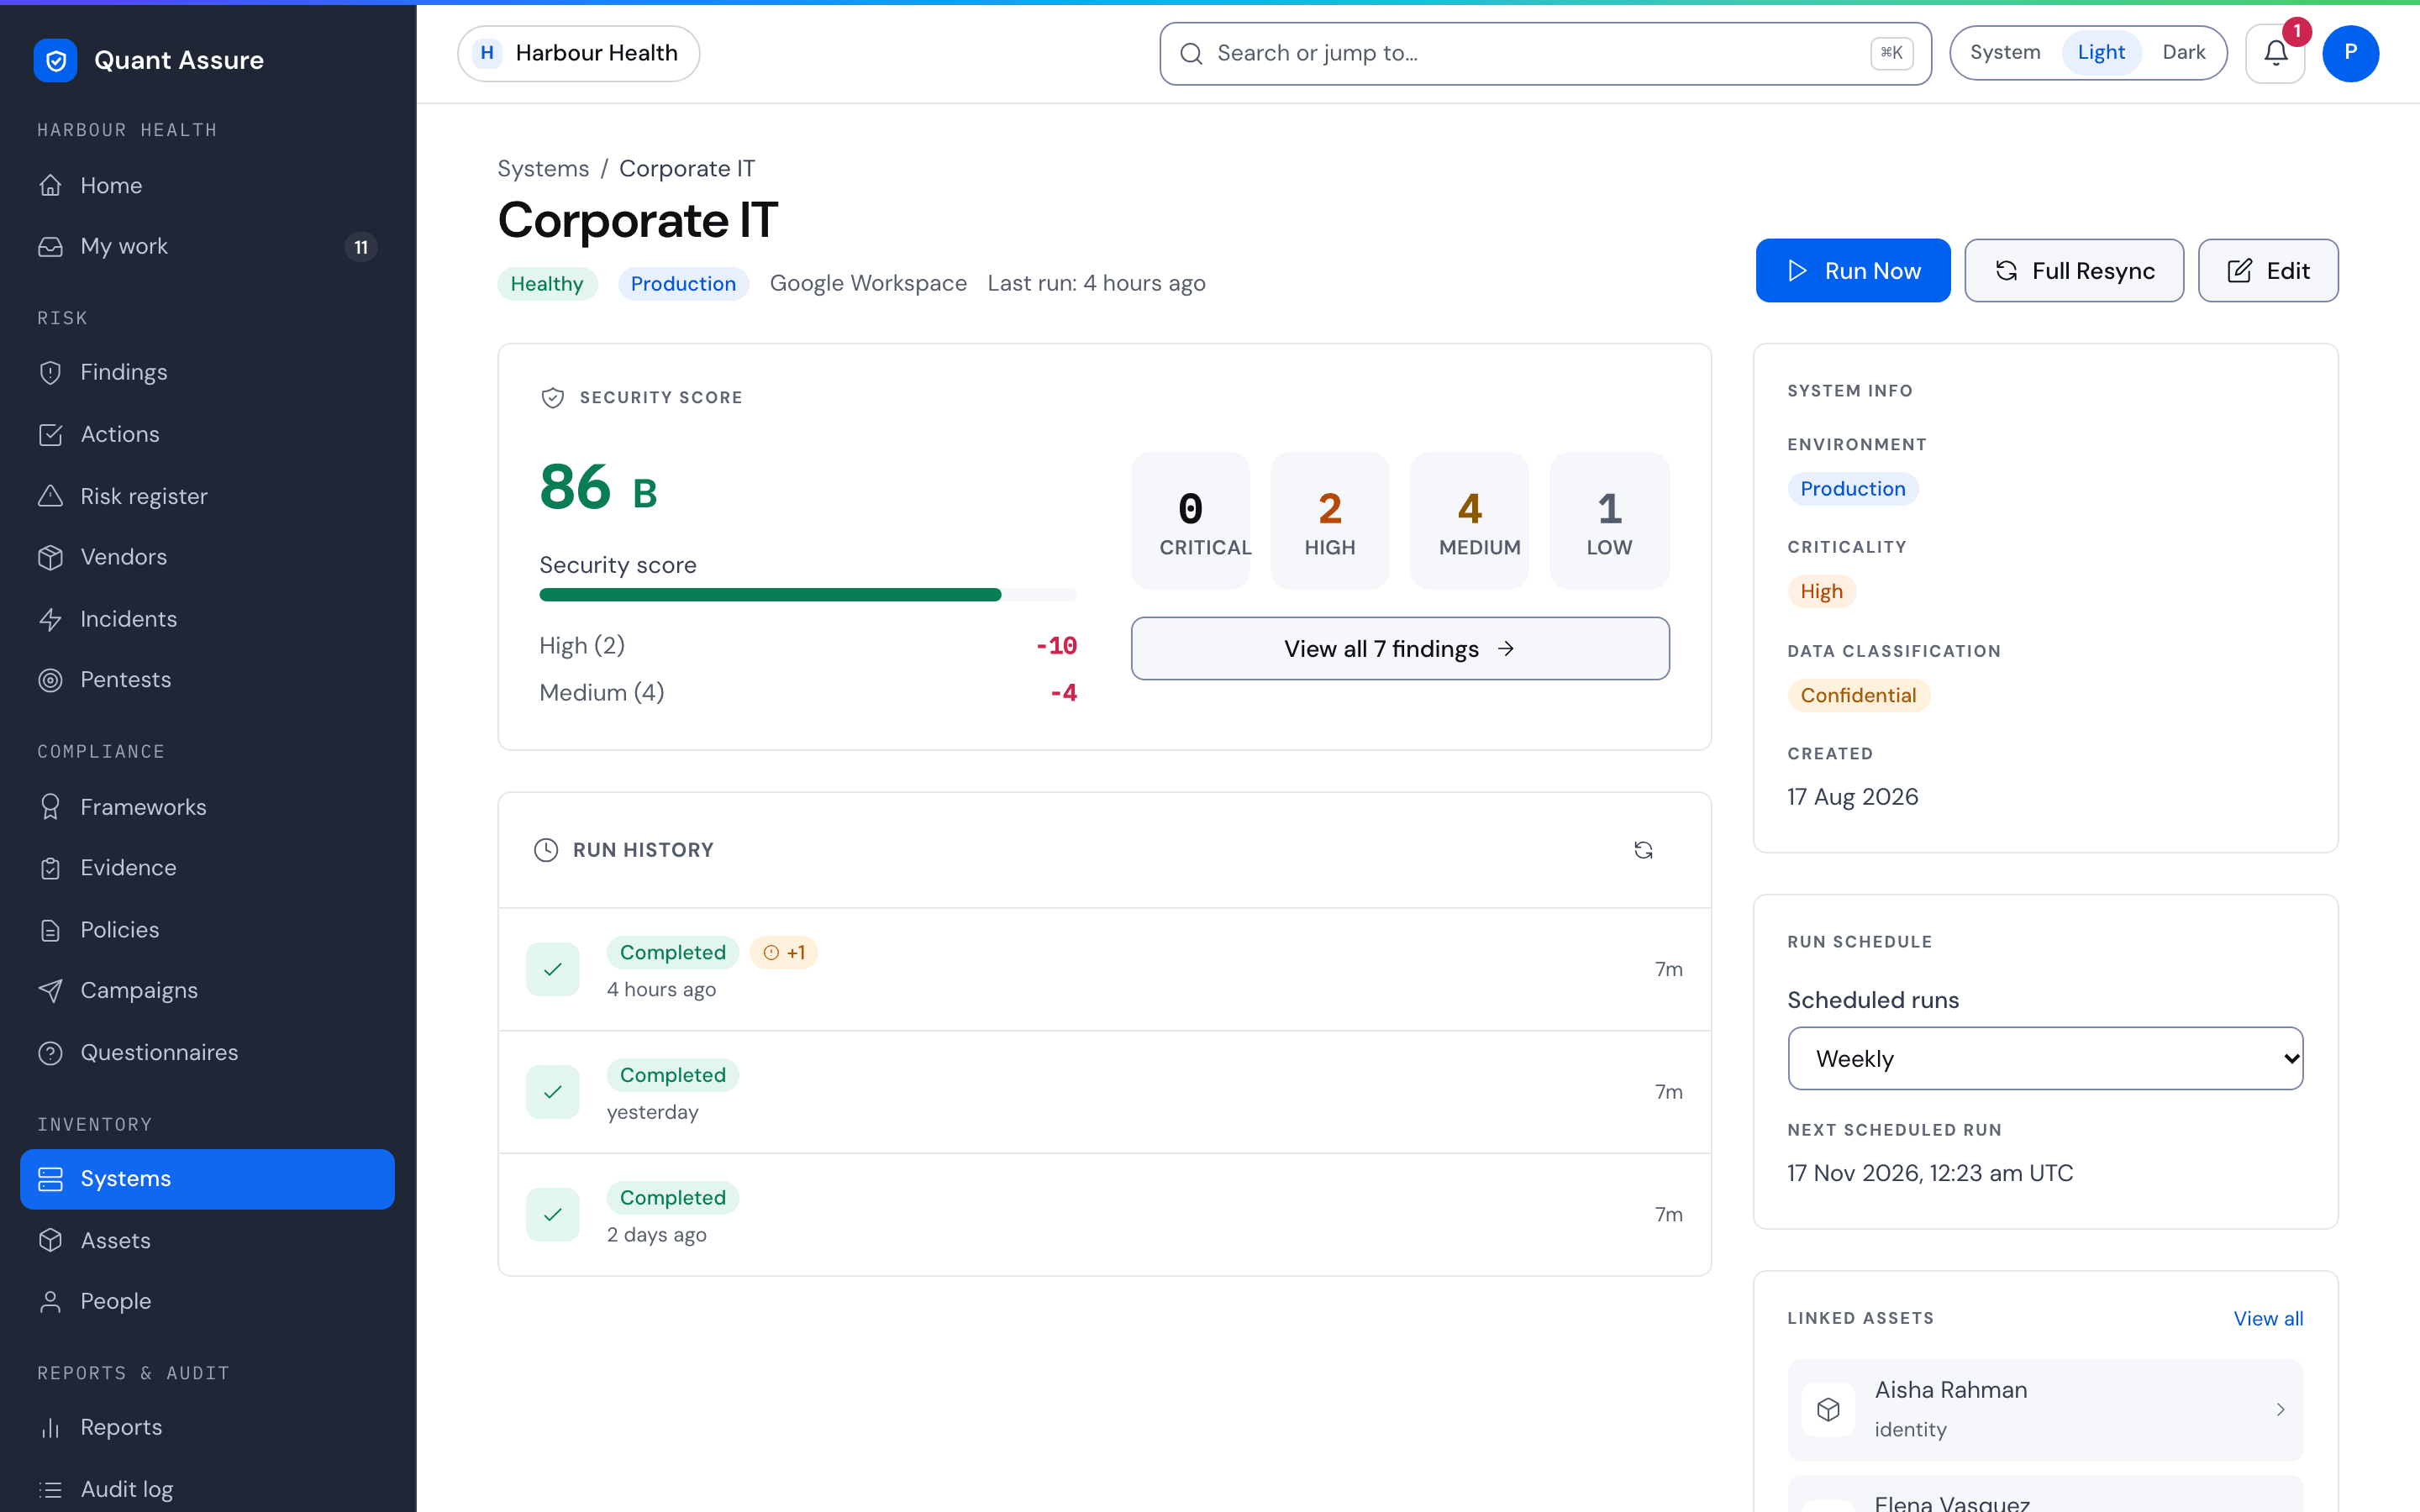
To change it, open the system and use Run schedule in
the sidebar. The change saves as soon as you pick a value, and is
recorded in the audit log. Anyone who can edit the system can change
it; viewers see the schedule but cannot edit it. Below the setting,
Next scheduled run shows when the system is next due,
or Not scheduled when the schedule is Off. A system that is
already due is started by the next hourly check. The new-system form
has no schedule field: new systems start on Daily, so change it on the
system page afterwards. The setting is also available as the
runSchedule field (off, daily
or weekly) on PUT /api/v1/orgs/:orgId/scopes/:scopeId,
which needs a signed-in person with edit access: API keys cannot edit
systems. See the API reference.
- A system is due when its latest run started about a day ago (daily) or a week ago (weekly), counting manual runs too, or when it has never run. Due systems are started by an hourly check that allows 30 minutes' slack, so a daily system keeps roughly the same hour each day instead of drifting later.
- Run Now and Full Resync stay available whatever the schedule. A manual run postpones the next scheduled one.
- Run Now collects from the system and compares the result with what QuantAssure already holds, so only new, changed and resolved items are processed. Full Resync collects the same way but skips that comparison and processes every item as if it were new, including triage. Existing records are updated, not duplicated. Use Full Resync when you want everything reassessed, for example after changing the system's configuration; use Run Now for routine collection. Both buttons are shown to members who can edit the system, not to viewers.
- A scheduled run has no user attached, and its audit log entry says it was scheduled.
- A scheduled run is skipped, not failed, while a run for the same system is still in progress, the system is disabled, no collector is enabled, an enabled collector is missing a required setting, or the organisation has no API access configured. Fix the configuration and the next hourly check picks the system up.
- Scheduled runs use the same pipeline, plan limits and credentials as a manual run.
A failed connection check usually means an expired or mistyped token, or a token without the permissions the collector needs. Fix the credential and save again; the per-source setup guides below list the permissions each collector requires. The check tests the saved configuration, so save before testing.
Credentials you enter here are stored per-organisation and only ever used by your runs and connection checks. Configuration changes are recorded in the audit log by field name; credential values are never logged.
A saved credential is never shown again, in the dashboard or the
API. The edit form marks it Saved: leave the field blank
to keep it, type a new value to replace it, or tick
Remove saved value (Remove for a
Google service account key) to delete it. Through the API, a system
config returns each saved credential as
••••• (saved); send that value, an empty value, or
leave the field out to keep it, and send null to
remove it.
Per-source setup guides: GitHub, AWS SecurityHub, Mosyle, Google Workspace — or see the integrations overview.
Disabling or removing a data source, or deleting the system, moves that source's open findings to Source removed. They leave your posture score, SLA timers and open counts but are never counted as fixed. Re-enable the source and they come back with their previous status when a later run reports them again. See Findings.
Marketplace Connectors: Push-Based Events
For real-time sources, install the connector once and events flow in as they happen — no polling schedule:
- AWS EventBridge connector — forwards security-relevant CloudTrail events (IAM changes, logging disabled, security-group changes) as findings with ISM control mappings
- GitHub App — installed from the GitHub Marketplace against your org; repository and security events stream in
- Google Workspace Marketplace app — domain-install with OAuth; identity and configuration data without service-account key handling
Connector-received findings go through the same AI triage as pulled ones.
Watch Your First Run Complete
Once triggered, the run works through its stages: collect (inventory + raw findings) → expand (turn inventory into compliance findings) → enrich (dependency trees, repo context) → AI triage (severity reclassification with reasoning) → your dashboard. Runs and their stage-by-stage progress are visible under Run History on each system's page — watch the first one until it reports complete, then head to Findings. Stages can run in parallel, so a running run shows the stage in progress and how many stages are done.
Run outcomes
- Completed — every stage finished.
- Completed with warnings — the run finished, but some stages collected partial results (for example, a few repositories could not be read) or failed. The warning names what was missed; the findings that were collected are still saved.
- Failed — with one of: Collection couldn't be started, Collection stopped unexpectedly after N minutes, Collection timed out after N minutes, or a note that the system's configuration needs attention. Run it again from the system page; if it keeps failing, contact support with the system name.
- A run that could not start still appears in the system's run history as Failed, with the reason and what to do next, and the system page shows why the last collection failed. If the reason is that your organisation's access to QuantAssure's services isn't set up, starting another run won't help: contact support, who set it up for your organisation.
Owners and admins are notified when a run fails or a system is disabled — see Stay Informed.
Security Score
Each system shows a security posture score (0–100), calculated from AI-adjusted finding severities: critical findings have the highest negative impact, and resolved findings improve the score. It uses the same calculation as the posture score on the home dashboard, applied to the system's open findings. View the breakdown on the system detail page.
A system shows Not yet measured instead of a score until a collection has completed for it, either a run or a push connector delivery. A system that has never run, whose first run is still going, or whose only runs failed has no score: no findings is not the same as no problems. When the latest run fails, the system page says why and offers the next step, either Run again or Edit system. If an earlier run succeeded, the score from that run stays visible.
Next step → Your first findings — read the list, see what the AI reclassified and why, and decide what deserves your first hour.